

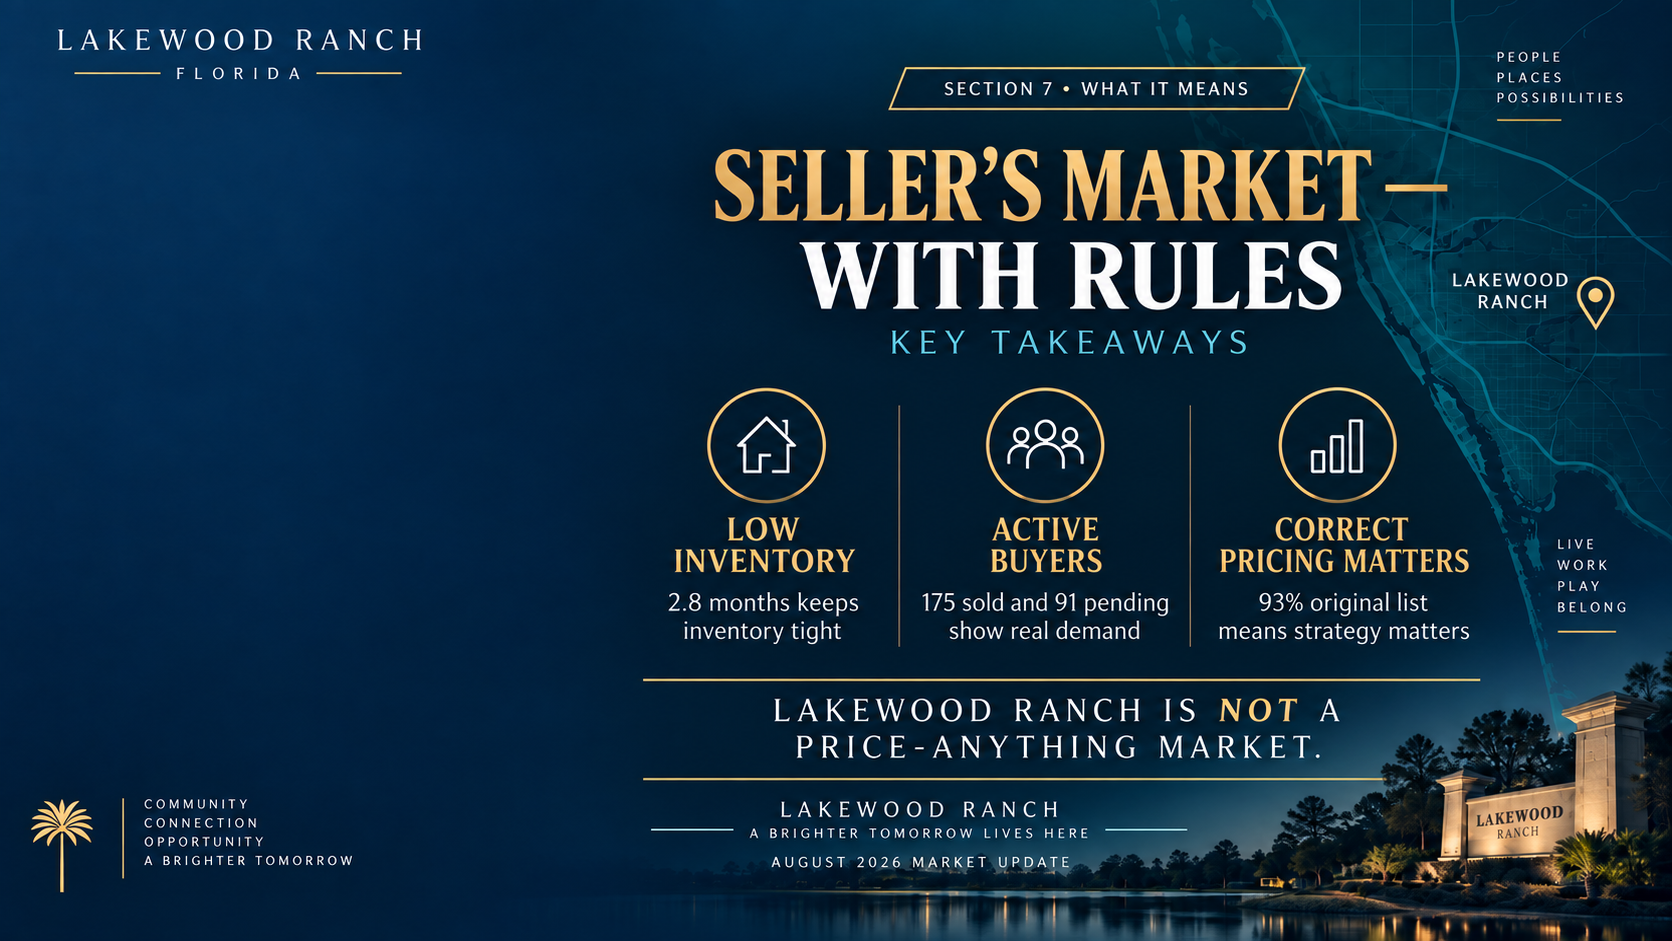
This Lakewood Ranch market update tells a different story from the headlines predicting either a runaway seller’s market or a flood of discounted homes. In August, inventory remained tight, buyers stayed active, and prices strengthened. Yet sellers still needed to price their homes carefully to attract an offer.
That combination matters whether you are preparing to list your home or deciding when to buy. Limited inventory can give a properly priced property an advantage, but it does not give every seller unlimited pricing power.
My takeaway is straightforward: inventory is tight, buyers are active, and pricing correctly matters more than ever. Here are five trends from my August video and what they mean for your next move.

In This Report
- How to read the two data sets
- 1. Inventory stayed tight
- 2. Buyers remained active
- 3. Prices strengthened
- 4. Correct pricing narrowed the negotiation gap
- 5. Homes sold on different timelines
- A practical plan for buyers and sellers
- Frequently asked questions
How to Read This Lakewood Ranch Market Update
I use two sets of numbers because Lakewood Ranch does not fit neatly inside a ZIP-code boundary.
The first is a Trendgraphix report covering ZIP codes 34202 and 34211. This report provides a historical view of inventory, prices, sales, and marketing time. It helps show how the market has changed from one month or year to the next.
However, those ZIP codes do not perfectly define Lakewood Ranch. They leave out the portion of the community in Sarasota County and do not provide the same geographic coverage as a search around the community itself.
My second data set is an MLS map search around Lakewood Ranch. It provides a closer look at single-family homes within the community. Think of Trendgraphix as the trend and the MLS map as the close-up view.
Keep these two sources separate when comparing the numbers. A difference in median price or sales volume can reflect different geography and property mixes. It does not necessarily mean the reports conflict.
| Measure | ZIP codes 34202 and 34211 | Lakewood Ranch MLS map |
|---|---|---|
| Inventory | About 2.8 months, based on closed sales | 309 active single-family homes at the report snapshot |
| Year-over-year inventory change | About 18% lower | Not stated |
| August closed sales | 161 | 175 single-family homes |
| Pending activity | Increased from July | 91 homes reported going pending |
| Median sold price | $720,000 | Just over $730,000 |
| Average sold price | $884,000 | About $885,000 |
| Average sold price per square foot | $337 | Not stated |
| Sale-to-list-price measure | About 93% of original asking price | Average about 98% of final asking price; median about 99% |
| Marketing time | 66 days on average | About 50 days median to contract; about 73 days on average |
Figures are rounded as presented in the video. Active listings reflect the report snapshot rather than today’s available inventory. The two columns describe different search areas.
1. Inventory Stayed Tight
The first finding in this Lakewood Ranch market update is that available supply remained limited relative to sales. The ZIP-code report showed approximately 2.8 months of inventory, based on closed sales.
Using the under-three-month benchmark discussed in my video, that puts this report in seller’s-market territory. Inventory in 34202 and 34211 was also about 18% lower than a year earlier.
Within my Lakewood Ranch MLS map, there were 309 active single-family homes at the time of the report. That was slightly below the end-of-July level discussed in the video.
These numbers do not support the idea that inventory was exploding. Buyers had choices, but the market was not showing a broad oversupply in this report. For sellers, that created an opportunity to stand out when a home’s price and condition matched what buyers wanted.
It is important not to apply the 2.8-month figure to the map search as though it were separately calculated for that area. The inventory ratio comes from the ZIP-code report; the 309 active homes come from the MLS map.
2. Buyers Remained Active
There were 161 August sales in the Trendgraphix area, slightly above the same month a year earlier. Pending sales in that report also increased from July.
My Lakewood Ranch MLS map showed 175 closed single-family homes during August and another 91 homes going pending. Those figures show buyers making decisions and transactions moving forward.
Pending and closed sales are different stages of a transaction. A pending home is under contract, while a closed home has completed the sale. The pending count should not be added to closed sales and presented as completed purchases.
For homeowners, the practical message is that demand had not disappeared. A listing still needed to earn buyers’ attention, but this was not a market where nothing was selling. Buyers were active and selective at the same time.
3. Prices Strengthened in August
Pricing was one of the most important changes in this Lakewood Ranch market update. The ZIP-code report showed a median sold price of $720,000, approximately 3% higher than the previous August.
The average sold price was $884,000, and the average sold price per square foot increased to $337. In my Lakewood Ranch MLS map, the median closing price was just over $730,000 and the average closing price was about $885,000.
Those results showed stronger pricing in August. They did not support the idea of a broad price collapse during the reporting period.
Still, median and average prices should not be treated as a valuation of your own home. The median is the middle sale in a group, while an average can be influenced by higher-priced transactions. Both can also shift when the mix of homes sold changes.
A neighborhood-specific comparison remains essential. Your home’s condition, location, features, and competing listings matter more to an individual pricing decision than one community-wide headline.
4. Correct Pricing Narrowed the Negotiation Gap
One of the clearest lessons in this Lakewood Ranch market update comes from the difference between original asking price and final asking price.
Trendgraphix showed homes selling for about 93% of their original asking price. That gap can include price reductions made before a buyer writes an offer. It should not be interpreted as a guaranteed 7% discount negotiated at the contract stage.
In the Lakewood Ranch MLS map, homes sold for an average of about 98% of their final asking price, with the median near 99%. Once a property reached a price buyers considered appropriate, the remaining gap was much smaller.
Consider a hypothetical example. A home starts at $800,000, reduces its asking price to $760,000, and eventually sells for $744,000. The sale is 93% of the original price, but about 98% of the final asking price.
That example is an illustration, not an actual transaction from the report. It shows why the two percentages tell different stories. A seller can end up close to the final list price after making a meaningful adjustment earlier.
The lesson for sellers is to focus on where buyers see value from the start. Beginning too high can mean spending weeks or months making adjustments before attracting the right offer.
5. Homes Sold on Different Timelines
The Trendgraphix report showed 66 average days on market, down from 82 days a year earlier. Within the Lakewood Ranch map search, the median sold home took about 50 days to go under contract, while the average was about 73 days.
These figures describe the homes in the report. They are not a promise that a particular listing will sell in 50, 66, or 73 days.
The difference between median and average also matters. Some homes find buyers sooner, while others take longer and pull up the average. Condition, price, presentation, and competition all help explain why individual experiences vary.
For anyone planning a move, realistic expectations are valuable. Tight inventory does not mean an automatic immediate sale. A thoughtful pricing plan and a clear view of the competition remain important.
What This Lakewood Ranch Market Update Means for You
If you are selling: make the value clear early
The seller’s-market label is useful context, but it should not be the foundation of your asking price. Low inventory can help a properly priced home. It does not remove buyers’ ability to compare alternatives or walk away.
Start by reviewing recent comparable sales and the homes competing with yours. Then consider your property’s condition and how it will appear to buyers online and in person. Nearby new construction can also affect the comparison, particularly when builders offer aggressive incentives.
The goal is to position your home where buyers recognize the value immediately. For a broader view of local trends, explore my Lakewood Ranch market data page, then request a review of your specific neighborhood.
If you are buying: match your strategy to the property
The August numbers did not support waiting indefinitely for a huge wave of inventory or assuming every seller would accept a steep discount. Supply remained tight, and properly priced homes were selling close to their final asking prices.
Your negotiating position may be stronger when a home has been sitting, began too high, or faces competition from new construction. Those are reasons to investigate the property more closely, rather than assumptions that apply to every listing.
Compare recent sales, current alternatives, and the home’s condition before deciding what to offer. The right approach depends on the property and your priorities, not simply whether the overall market is labeled favorable to buyers or sellers.
Lakewood Ranch Market Update: Common Questions
Was Lakewood Ranch a seller’s market in August?
The ZIP-code report showed about 2.8 months of inventory, which met the seller’s-market benchmark used in my video. However, buyers remained selective. A limited supply of homes did not give every seller unlimited pricing power.
What was the median home price in the report?
The Trendgraphix report for 34202 and 34211 showed a $720,000 median sold price. The Lakewood Ranch MLS map showed a median closing price just over $730,000. These figures cover different geographic searches and should remain separately labeled.
Were sellers accepting large discounts?
The answer depends on which asking price you use. The ZIP-code report showed roughly 93% of original asking price, while the map search showed an average near 98% of final asking price. Earlier price reductions can account for much of the difference.
How long did homes take to sell?
The ZIP-code report averaged 66 days on market. In the MLS map search, the median time to contract was about 50 days and the average was about 73 days. Individual listings can take more or less time.
Are these live market numbers?
No. This article reflects the August report discussed in the accompanying video. Before making a decision today, review updated comparable sales and available listings for the specific neighborhood and property.
Watch the Full August Market Report
Watch my original August market update on Living in Lakewood Ranch Florida for the full explanation behind these numbers.
Get a Plan for Your Lakewood Ranch Home
The most useful Lakewood Ranch market update connects the numbers to your own situation. August showed tight inventory, active buyers, and stronger pricing, with the best opportunities depending on how a specific property compared with its competition.
If you are considering buying or selling, I can break down what is happening in your part of Lakewood Ranch. Contact Mark Boehmig or call 941-807-6936 to discuss your neighborhood, your property, and your next move.
Source: Mark Boehmig’s August market-update video linked above. Figures are rounded as stated in the video and come from its Trendgraphix ZIP-code report and separate Lakewood Ranch single-family MLS map search. The underlying reports have not been independently re-run for this article.
